Roadmap Mockups - Business Intelligence
Home | Summary | Quality | Production | Cycle Time | Process Data | Torque Data | Serial Number | Configuration | Real Time | Cycle & WIP | OEE | Components
Dundas-to-Ember Conversion
For a couple of years, eFlex, with its vast real-time data collection, has been developing business intelligence into its Manufacturing Integrated Platform (MIP). At first, quickly integrating existing BI applications into the MIP application. But it was a bit clunky, having to install Windows to operate one such app, and it just didn't quite fit the bill. Finally, I got asked to design the styling for a native Business Intelligence function in the MIP application.
This is the configuration for the BI function, which can then be projected to Andon boards over the factory floor, station monitors, or any kind of Web-accessed display—accessed from anywhere.
HOME

SUMMARY
 System Indicators
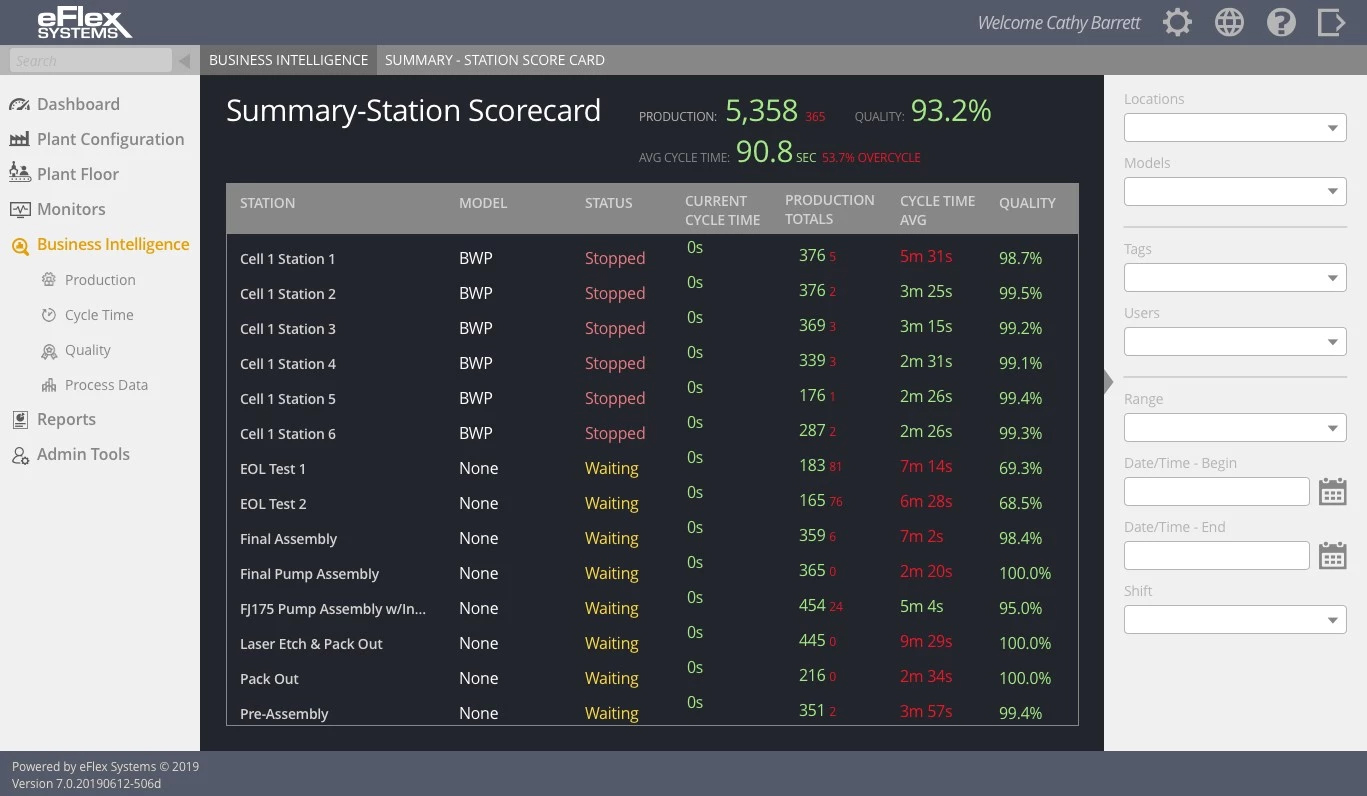 Station Score Card
QUALITY
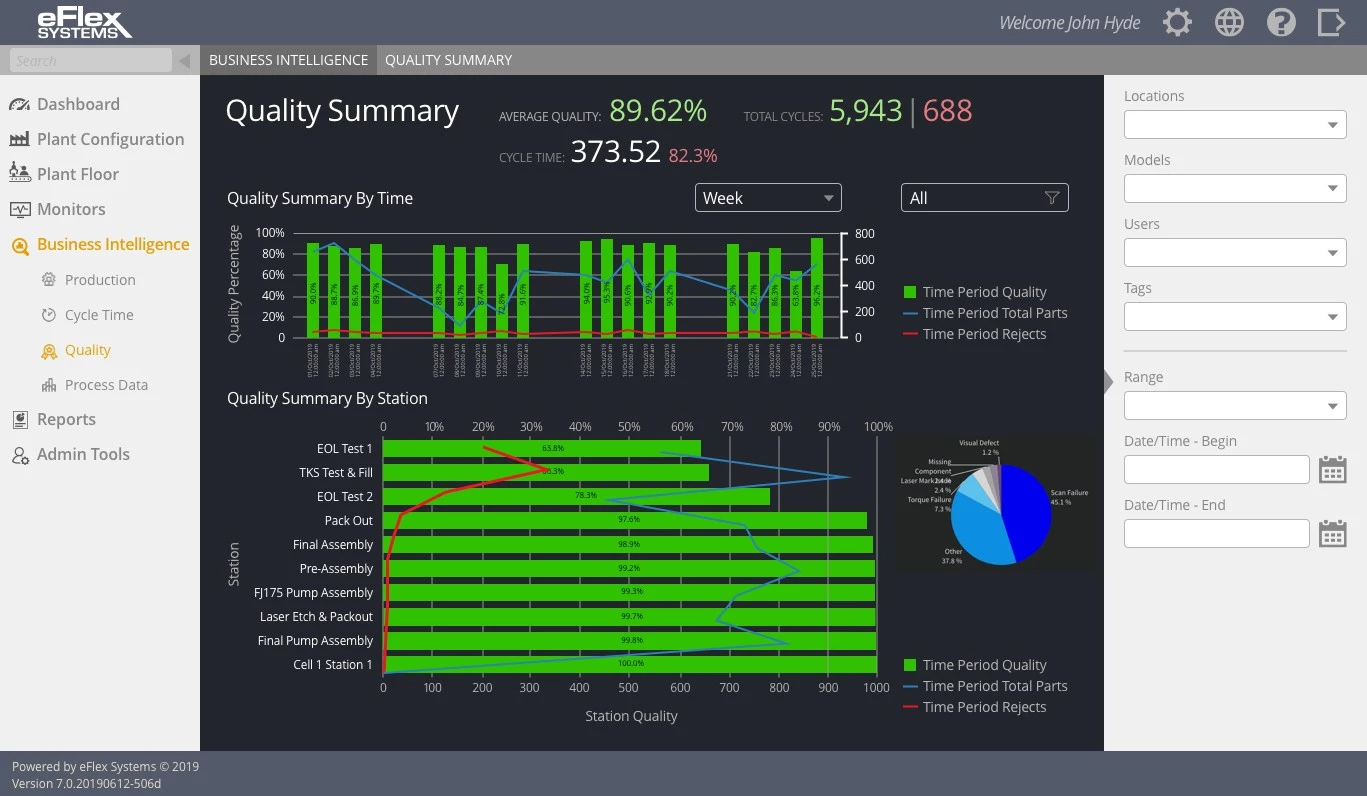 Quality Summary w/Quality Time Series Bar Chart Component
 Quality Individual Station w/Quality P Chart Component
 Quality Individual Station Details
 Quality Individual Task
PRODUCTION
 Production Summary (w/Date Range Picker & Tokens)

 Production First-Yield-Pass
CYCLE TIME
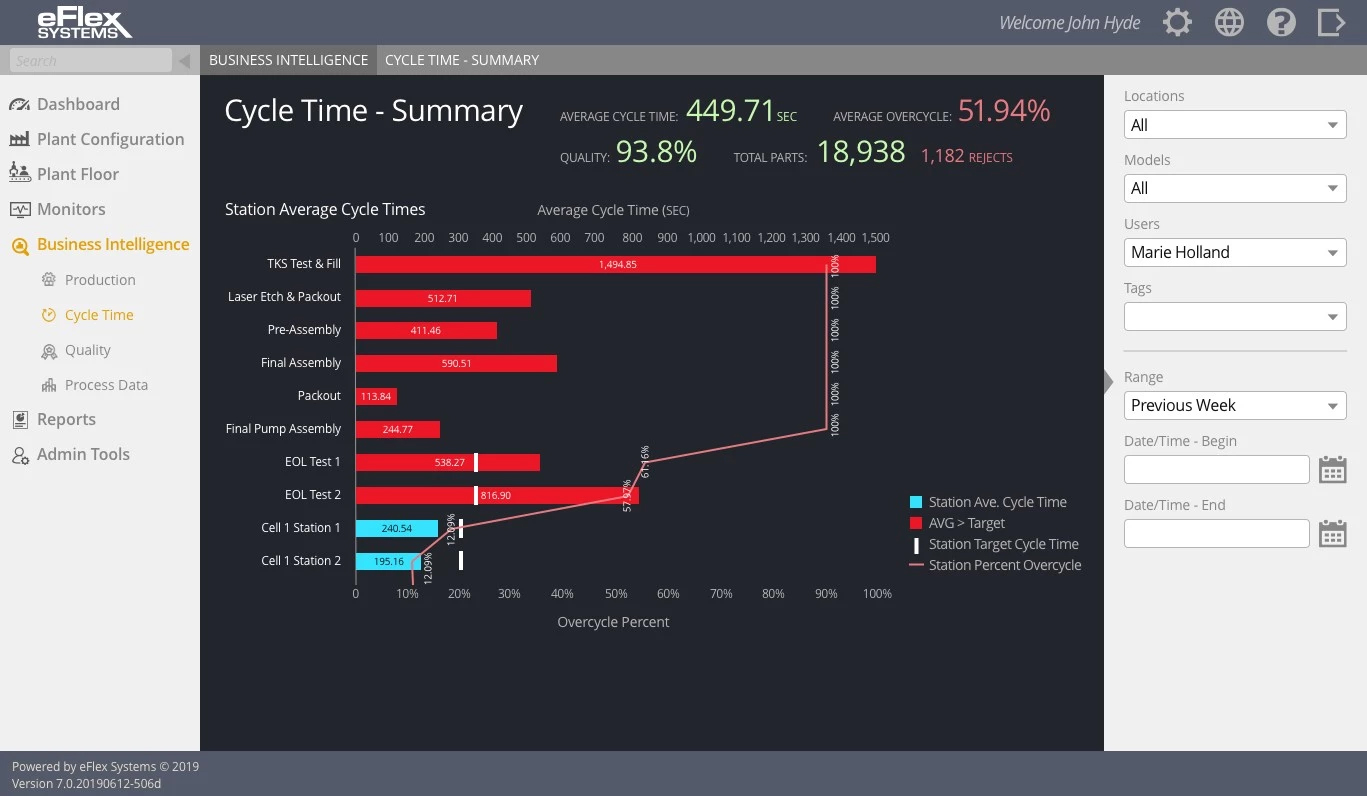 Summary
 Individual Task
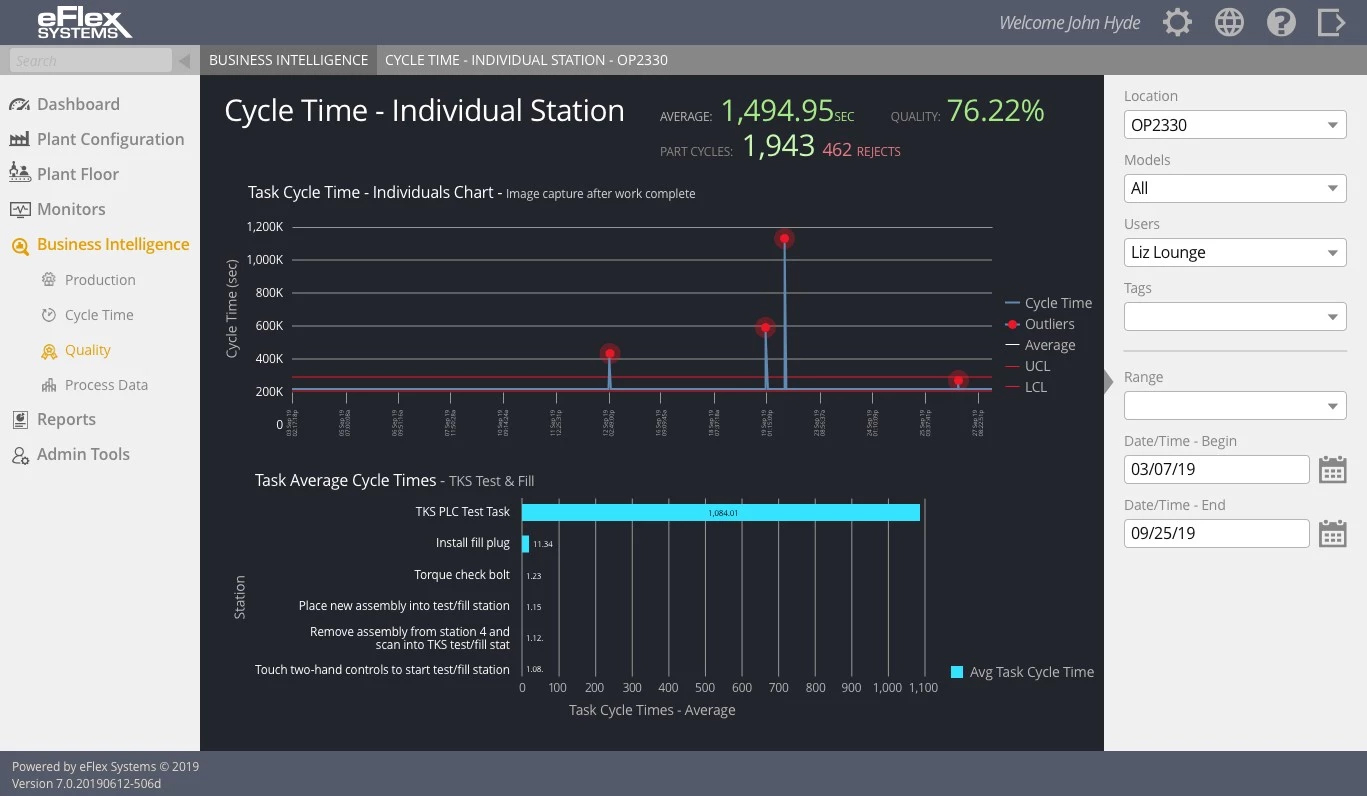 Individual Station
PROCESS DATA
 Summary
 Individual
TORQUE & ANGLE
 Summary
 Individual Torque & Angle
 Torque & Angle Detail Table
SERIAL NUMBER
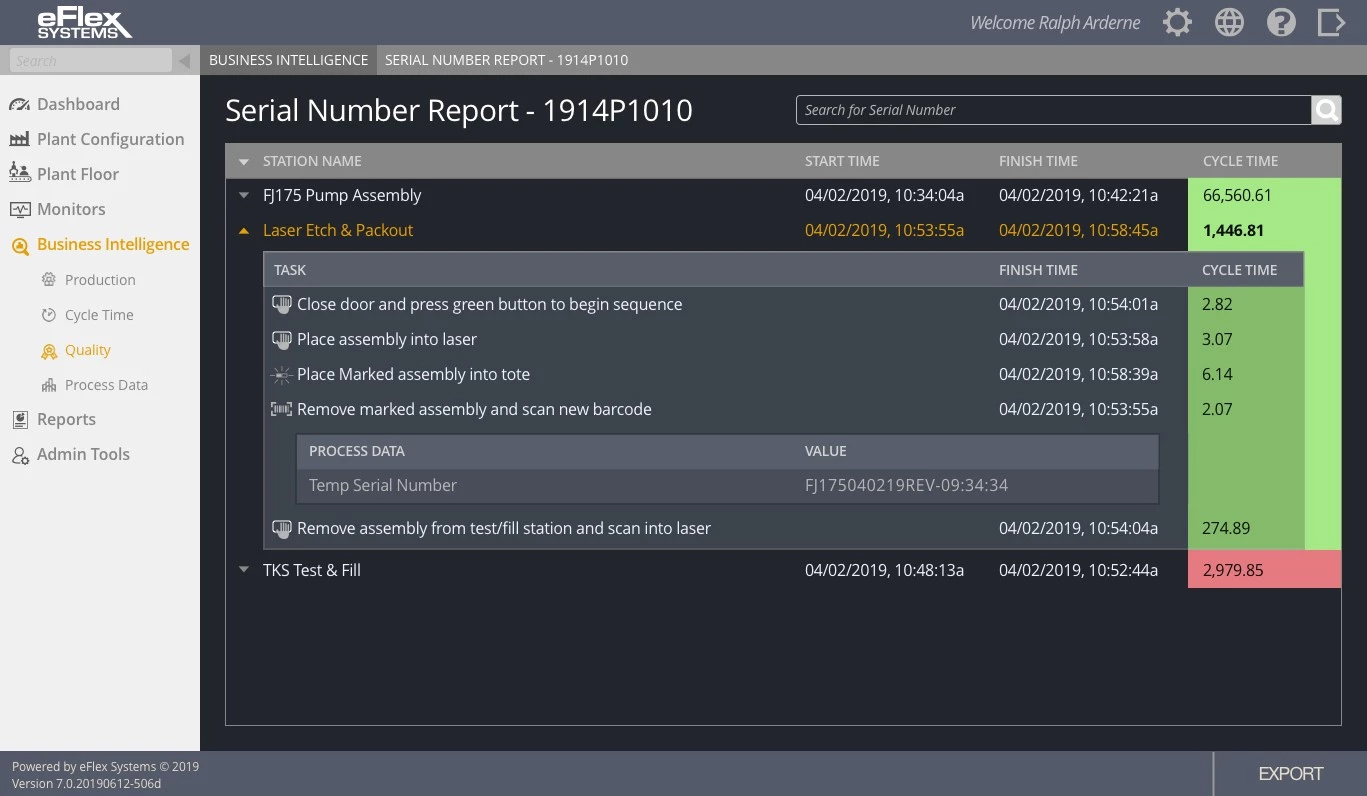
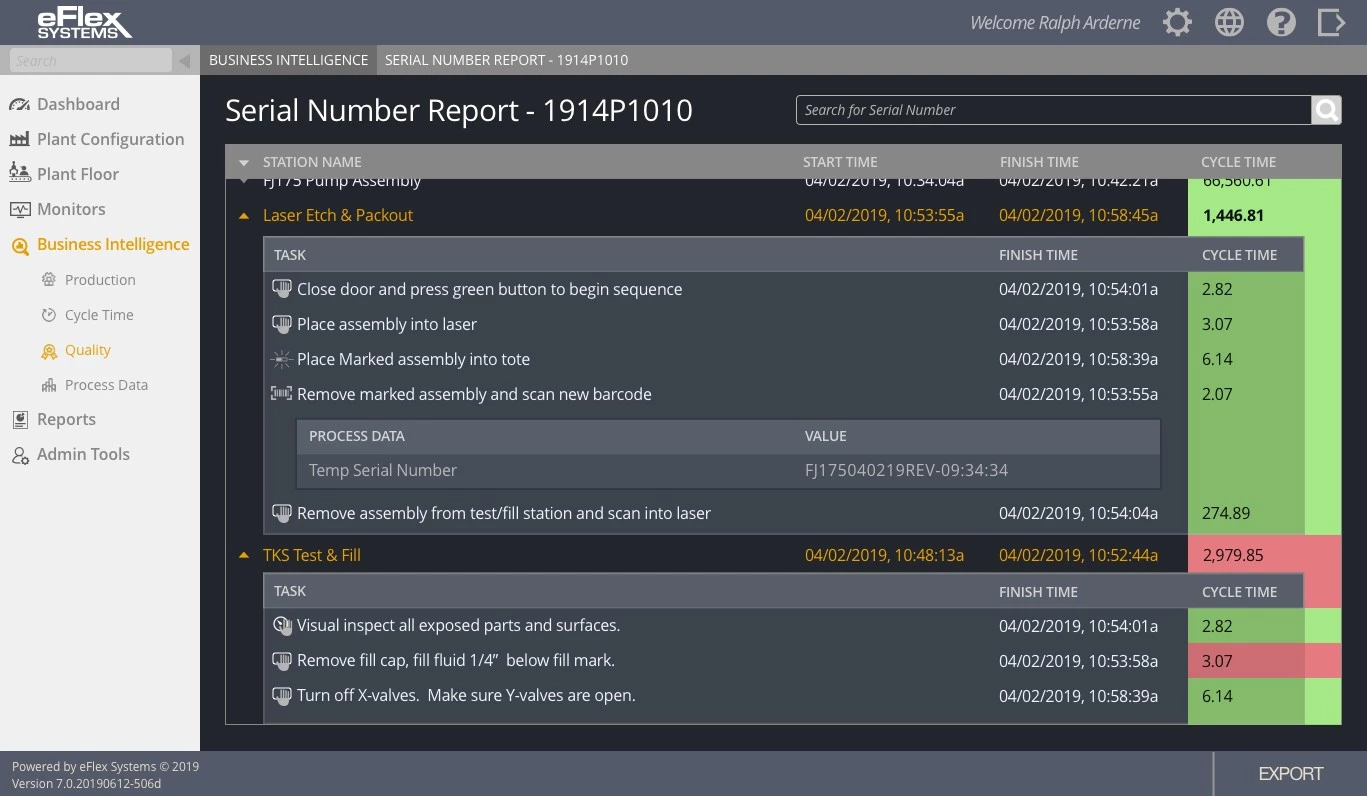
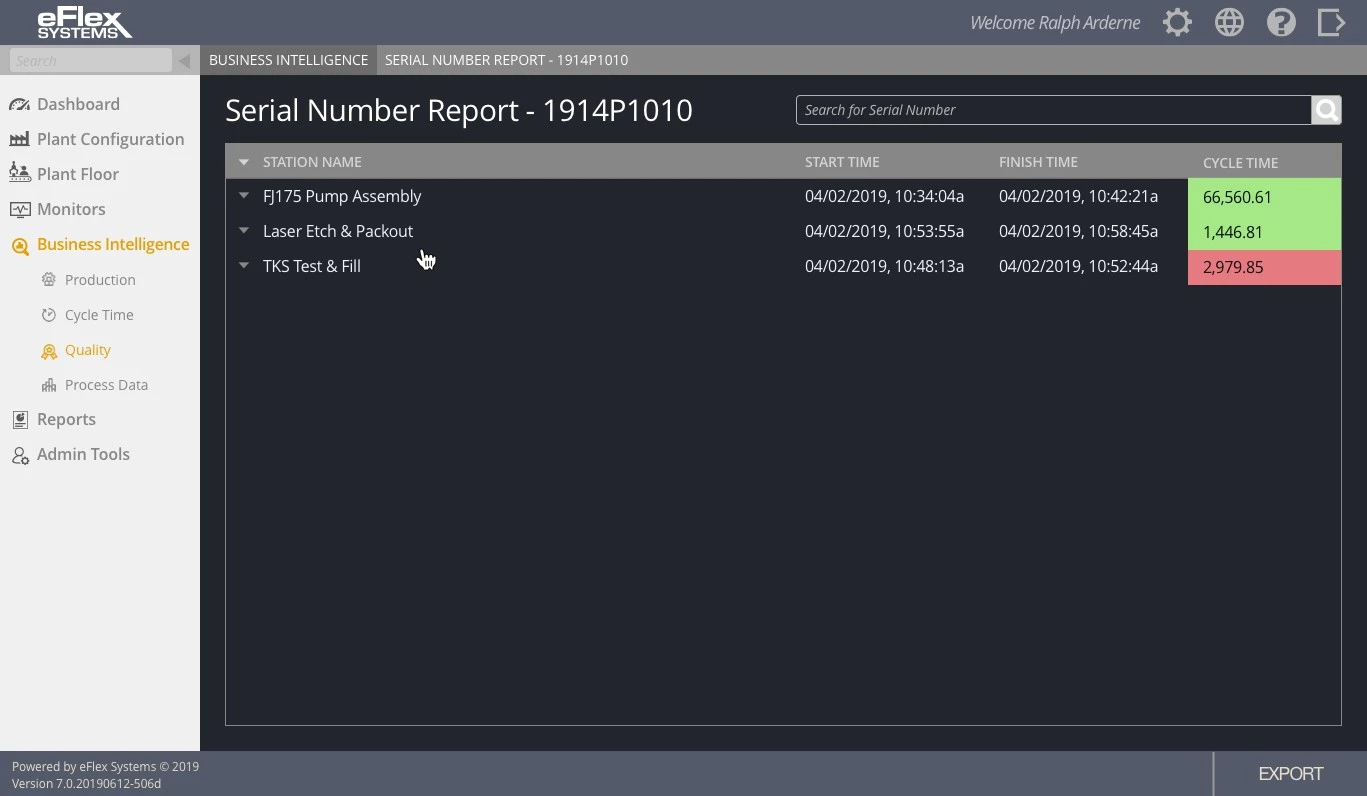 Serial Number Report
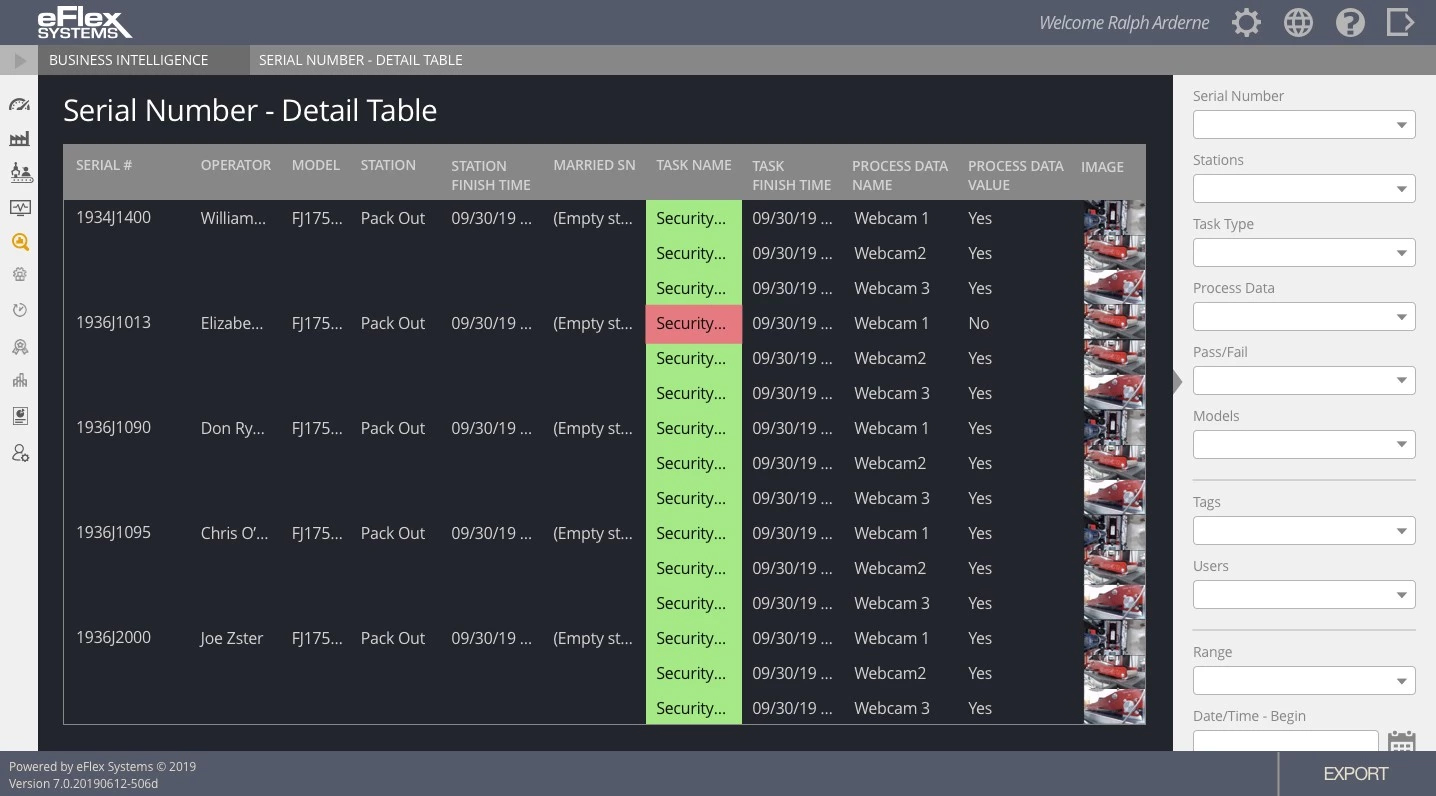 Serial Number Detail Table
 Serial Number Report - PDF/Print Version
CONFIGURATION
 Work Instruction Summary


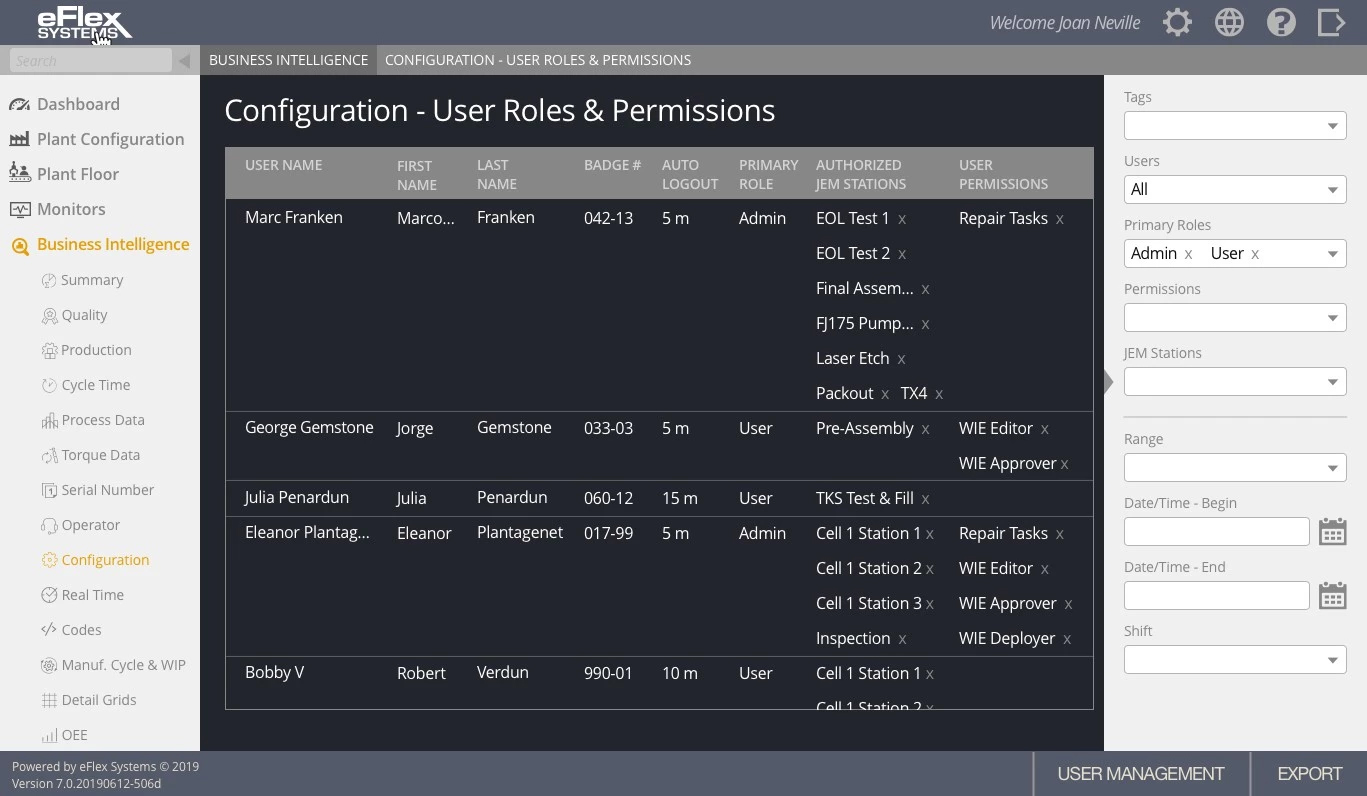 User Roles & Permissions
 Model Configuration Grid - Grid-View
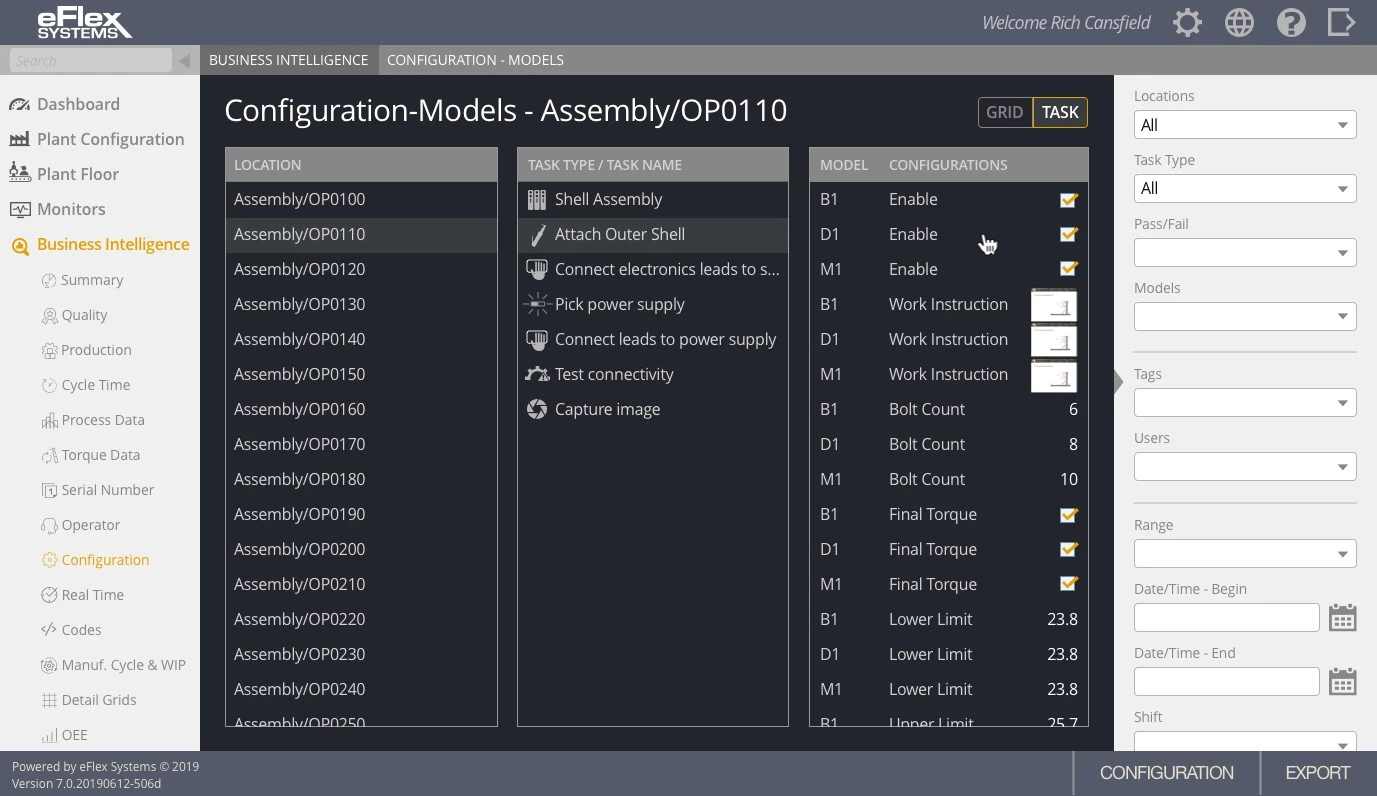 Model Configuration Grid - Task-View
REAL TIME
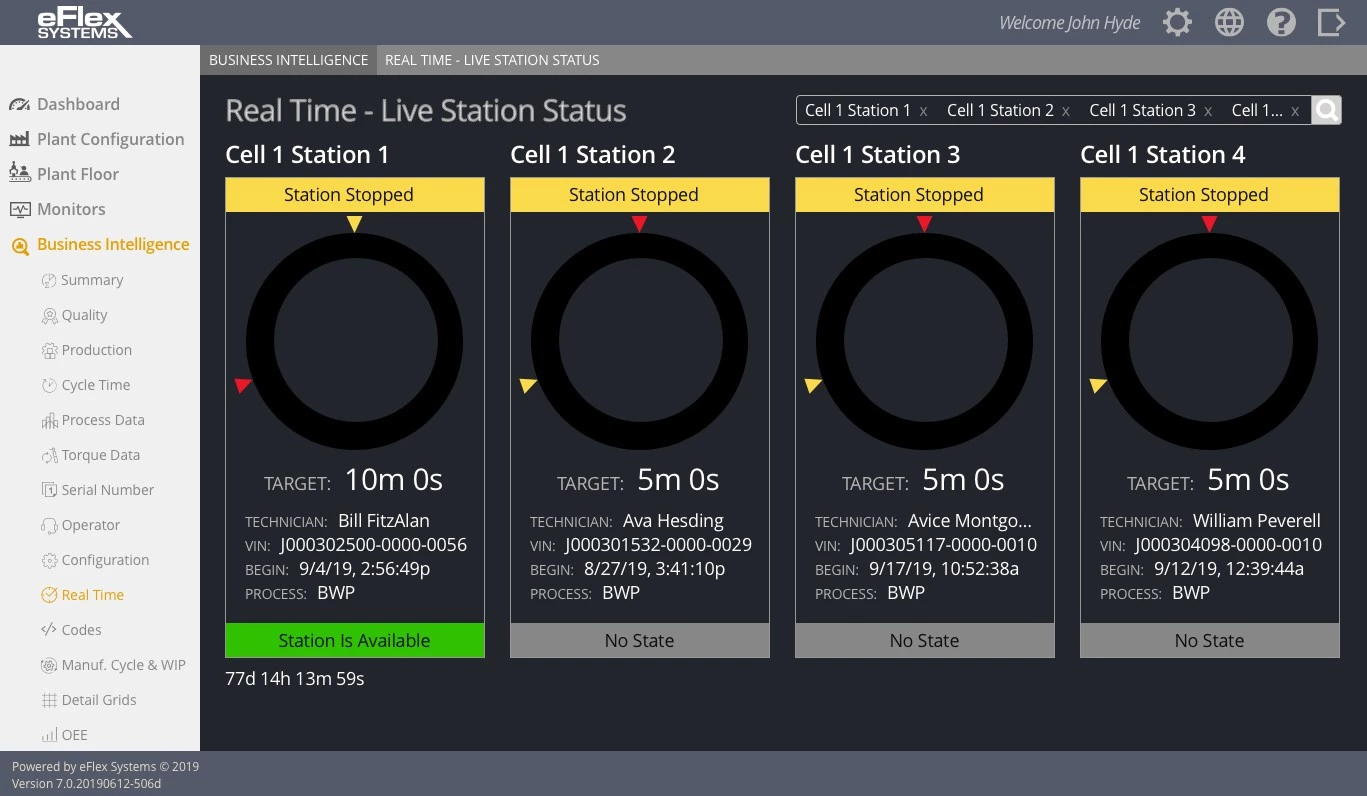 Station Status
MANUFACTURING CYCLE & WIP
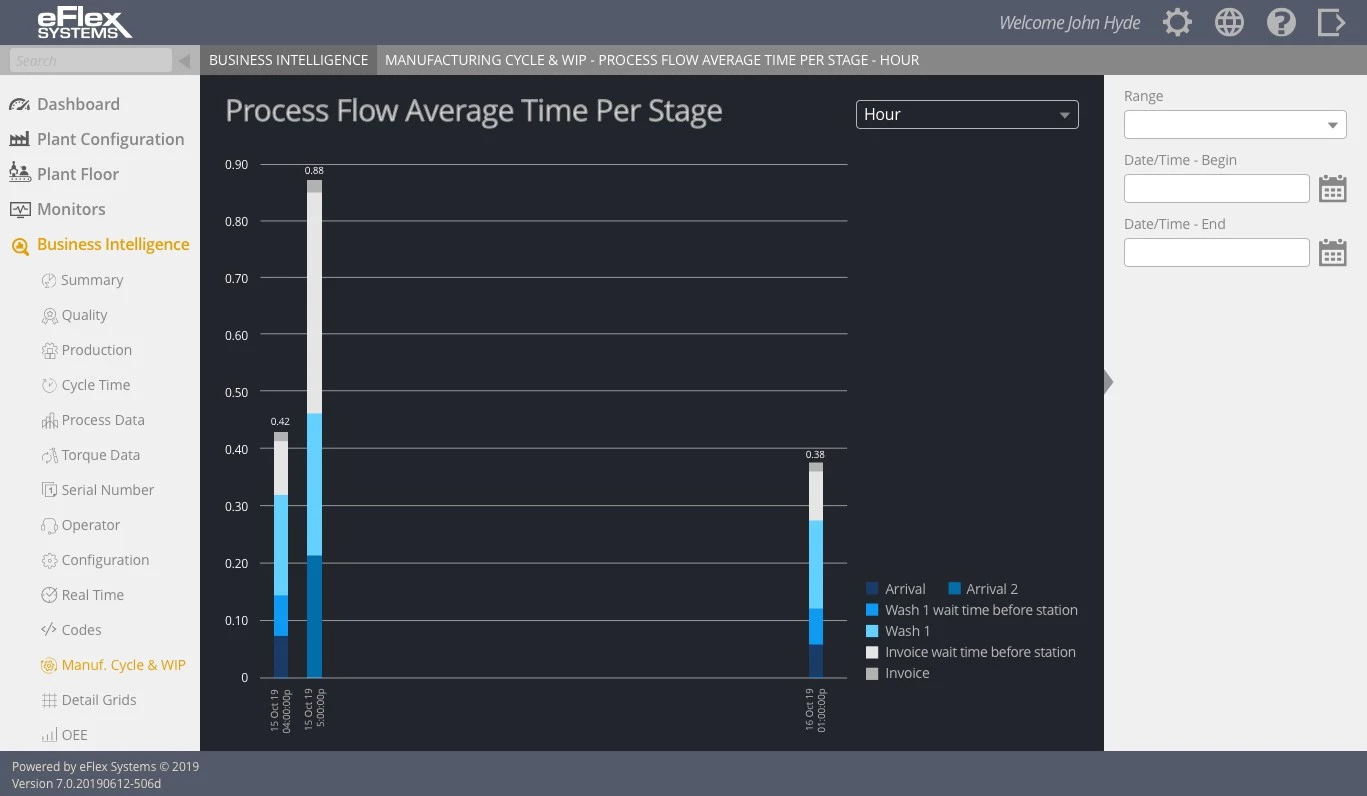 Process Flow Average - Hour
 Process Flow Average - Day
 Process Flow Average - Month
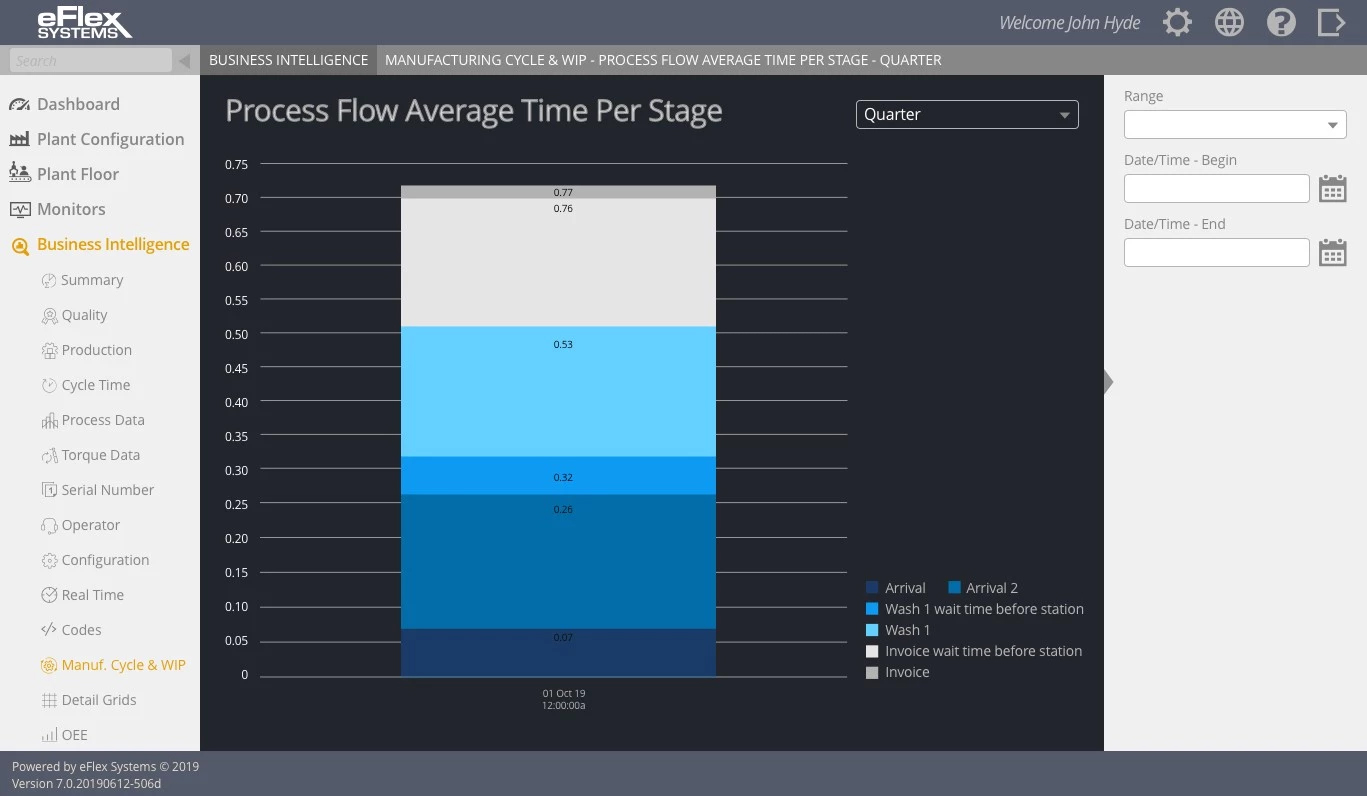 Process Flow Average - Quarter
 Process Flow Average - Year
 Serial Number Total Time In-Flow
OEE
 Station User Button Timeline
COMPONENTS
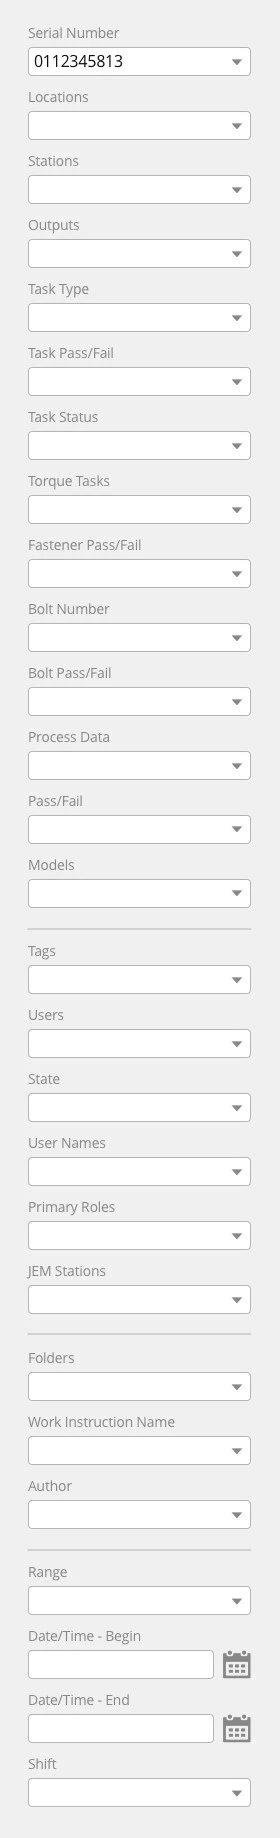 Criteria Filters (complete)
 Criteria Filters - Dropdown Listing
 Collapsible Side Panels


